
The Future of Network Observability and Network Automation
And How They Intersect

As I have previously written, I see networking through a three-legged lens: Network Services, Network Operations, and the Network Itself. (see: "WHY AND HOW CHOICES ARE MADE IN NETWORK ARCHITECTURE" )
Where does Network Observability come into the Network Automation discussion? Network Observability is crucial to the emerging operations plane/network operations function.
While Network Automation often focuses on setup, configuration, and scheduled changes, the bigger picture of Network Automation includes predictive and real-time mitigation and remediation.
Background
Recall that IP networks have a significant core of automation, beginning with a distributed understanding of the "best" path through a network. The interaction of other outcomes with this core automation often causes complexity and automation challenges. That is not a criticism of those aspirations, just an observation.
IP networks have many "domains," "segments," or whatever term you want. Some have many diverse paths; others have a few or even one. Sometimes, the complexity in networks comes from creating solutions for different parts of the network and then "bridging" them.
IP networks are the ultimate mitigation engines, routing around, not fixing, significant path problems. What more could be needed? An understanding of subtle issues in a network. That is where network observability and automation may intersect.
Who sees what?
Do routers (and switches) see the signals in logs/syslog? No.
Do routers see the signals that are in SNMP metrics? For the most part, no.
Do routers see the signals that are in SNMP traps? For the most part, no.
Do routers see the signals in Netflow? No.
Do routers see the signals from eBPF? No.
Do routers see the signals from applications and services? No.
The IP control plane exchanges a great deal of information. So much so that the industry often worries about putting more in (plus or minus waves of route engine silicon innovation). A tremendous amount of information lives outside the IP control plane, and it contains many clues as to what is going on inside the network.
What is the network?
I have tipped my hand by referencing eBPF above and implying other data. For many enterprises, the network is a mesh of TCP/UDP connections inside a public cloud over a physical network they have no visibility into, a private cloud, in some cases, a data center with network equipment the enterprise owns and operates, campus networks, and branch networks. Also, IOT, of course. Then there is SD-WAN/SASE. There are parts of the end-to-end network where an Enterprise has visibility to the physical equipment, and there are parts where it does not. All these different parts of the network, with different layers, have to come together in one holistic approach to observability and automation. That is not the same as saying the industry has to solve it all at once. Still, Enterprises that are maintaining assets outside public clouds will ultimately need a solution for these different network parts.
What Can Observability Tell You?
It can see a well-known error signature in a log, which can be mitigated or remediated with a well-known response.
It can identify a log message that has never been seen before and, therefore, needs attention.
It can forecast when an interface will run out of capacity.
It can identify when latency is not typical.
It can identify when an optical component is about to fail.
It can identify whether there is an unusual application traffic flow and, therefore, a potential DDOS attack.
It can identify whether a flow is experiencing an unusual number of TCP resets or retransmits and, therefore, possible impact on an application.
It can tell you if applications are experiencing DNS timeouts or an unusual request load on a DNS server.
It can tell you which cloud components can be reached from the public internet.
We are just scratching the surface here.
What do Observability Solutions need?
Topology
Some observability solutions focus on a single layer, for example, the IP layer. Don't alert the upstream problem if the downstream problem on the same layer has been identified. However, as noted above, networks can be multiple layers deep: TCP/UDP, IP, Ethernet, and Physical layer. That's not even considering service overlays, SD-WAN, container meshes in cloud services, and more. Once again, all this does not have to be bitten off at once; it is more than a mouthful, but these are the issues facing enterprises with hybrid IT. Ultimately, the lowest layer problem must be identified so upper layer alerts can be either suppressed, de-prioritized, or processed according to policy.
Alerts
Static thresholds work great for some metrics, for example, % error rate, but not so great for other metrics, such as latency - which can vary widely from link to link. So anomaly detection is now a growing part of the toolkit. Other useful alerts include a specified change in value, outliers among peers, and forecasts. Undoubtedly, AI/ML will give rise to others in the coming years.
Correlation
Garbage in, garbage out. Any function making real-time automation decisions does not need signals from different tools/data sources. It requires a single source of truth, which comes from multi-layer "root cause" analysis and collapsing multiple similar alerts into one.
Suppression
Are alerts during maintenance periods needed? No.
Do networking teams want to know about every element? No
These are just some of the reasons why there needs to be mechanisms for suppressing alerts, and those mechanisms should be API-based.
Policy
Automation functions will also need to receive policy-prioritized alerts. Some information, such as transient or future problems, needs to be stored and analyzed, even if not immediately actioned. Priorities are your friends here, as with anything in life.
CAMEL+
While cloud observability tends to focus on three main telemetry types, metrics, logs, and (application) traces, network monitoring tends to express Configuration, Alerts, Metrics, Events, and Logs (CAMEL), plus other data types such as flows. These all play a role in understanding what is happening in a network.
Meta-Data
There are many types of Meta-Data. Perhaps the most common in today’s network observability tools comes from a class of products known as “CMDBs”. Information from a CMDB provides human-understandable labelling for a resource, as one example. Another examples might include information about the element type. This is another example where an API is your friend.
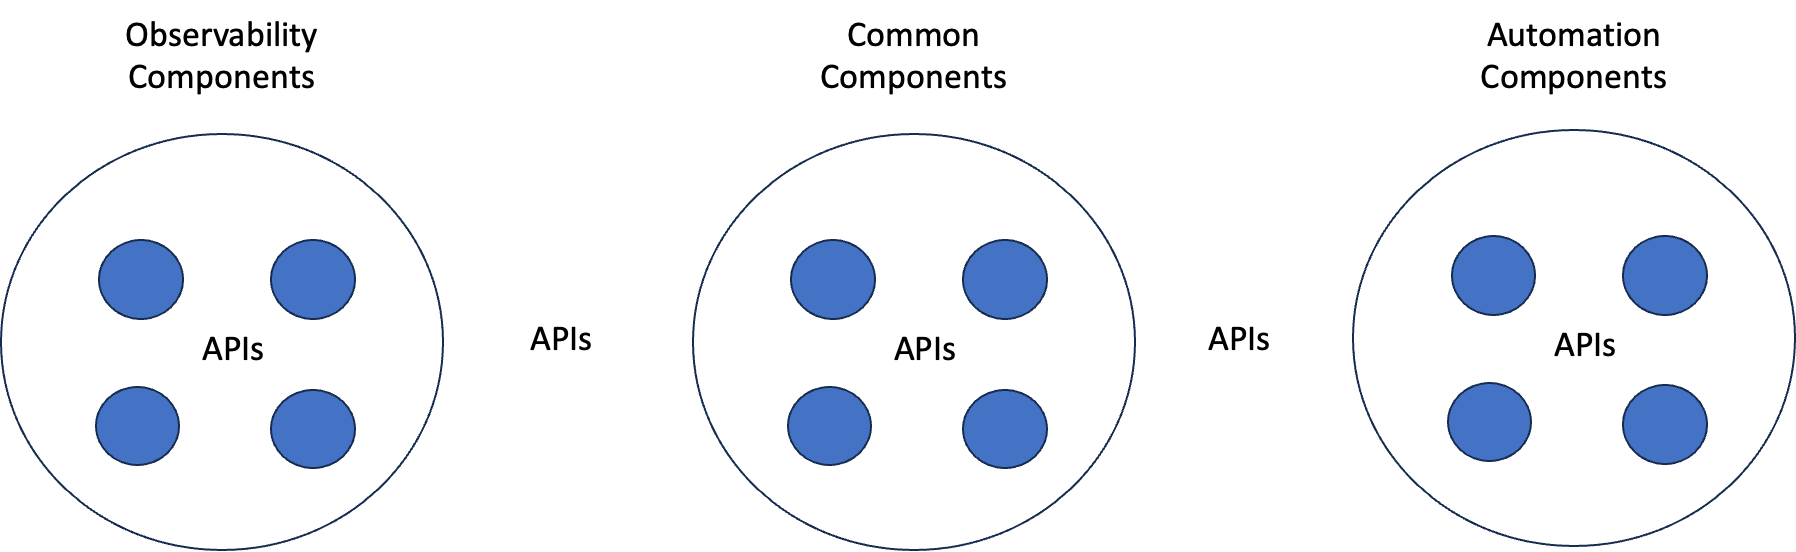
At The Intersection of Observability and Automation
From the above, it can be imagined common components of both observability and automation, for example Topology, CMDBs and Meta-data. How will future approaches to Observability and Automation recognize and manifest common components.
Of course, all this needs to occur in timeframes that support “real time” analysis and action.
How should automation components interact?
The cloud ecosystem has built a dynamic ecosystem that keeps exploding using JSON/REST-based APIs. There are good reasons to use xRPCs. I understand and don't deny it. If the industry is to evolve observability and automation ecosystems rapidly, REST is the way to go for many use cases. This way, interfaces do not have to be redefined every time there is a change.
And without existing well-used interfaces, the rapid evolution of APIs should be on the agenda, IMO.
Interfaces
Well-defined APIs are the work horses of programmatic approaches. Are they the only way?
When it comes to human interfaces, there are different perspectives on query-based vs non-query based. For non-query based, there are multiple approaches including selectable facets and tagging.
Another emerging approach is large language model (LLM) natural language interfaces. “Show me all the critical alerts”, for example. Could LLMs be used in programmatic approaches, returning JSON rather than text? There is likely to be unforeseen innovation in this area.
Conclusion
Network monitoring / telemetry / observability....delivers insights that are not available anywhere else. These insights will be critical to real-time mitigation and remediation. It is not a replacement for the IP control plane but an essential component of the architecture that includes operations/engineering, services, and the network itself.